Anthropic has introduced a major new capability for Claude AI, allowing the assistant to generate interactive charts and diagrams directly within the chat interface. Announced on March 12, 2026 via the official @claudeai account, the update enables users to visualise data instantly without needing external tools. Even more notable, the feature is available for free, signalling Anthropic’s push to make AI-powered data visualisation and analysis accessible to everyone.
This feature is live right now in beta for every plan including the completely free tier!!! No upgrade, no waitlist, no catch.
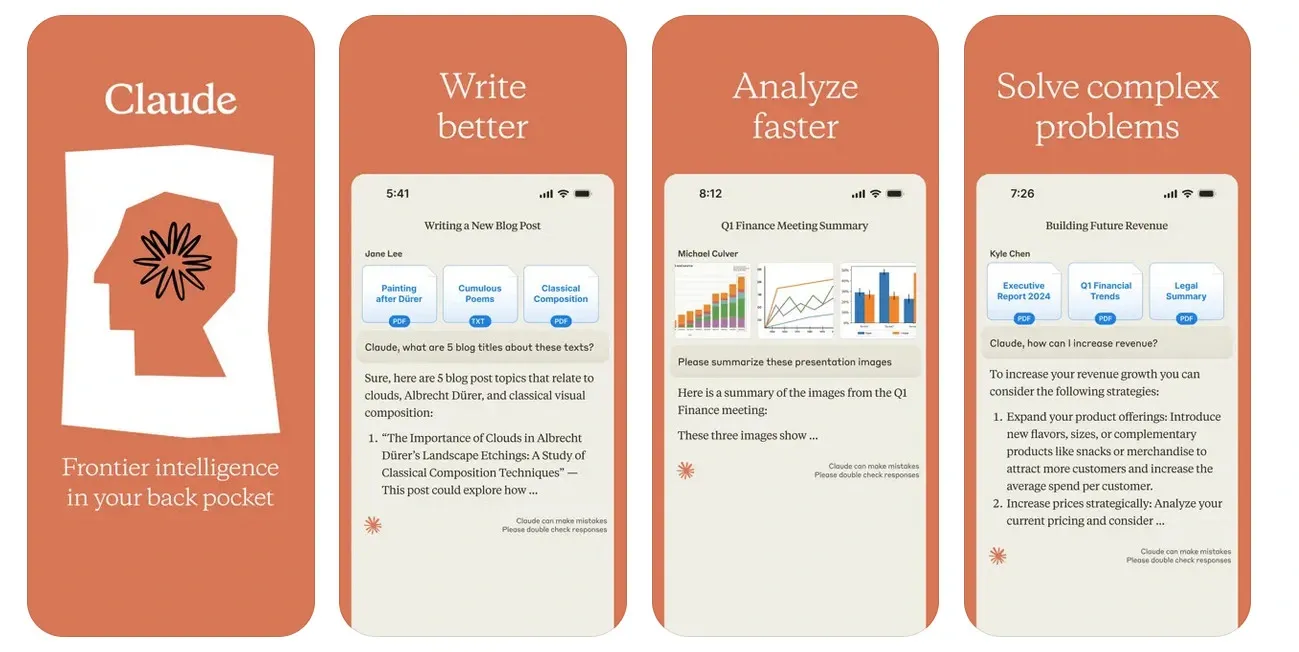
It’s being called “another banger” from Anthropic, and it’s easy to see why. Claude just turned from a smart text assistant into a full visual thinking partner.
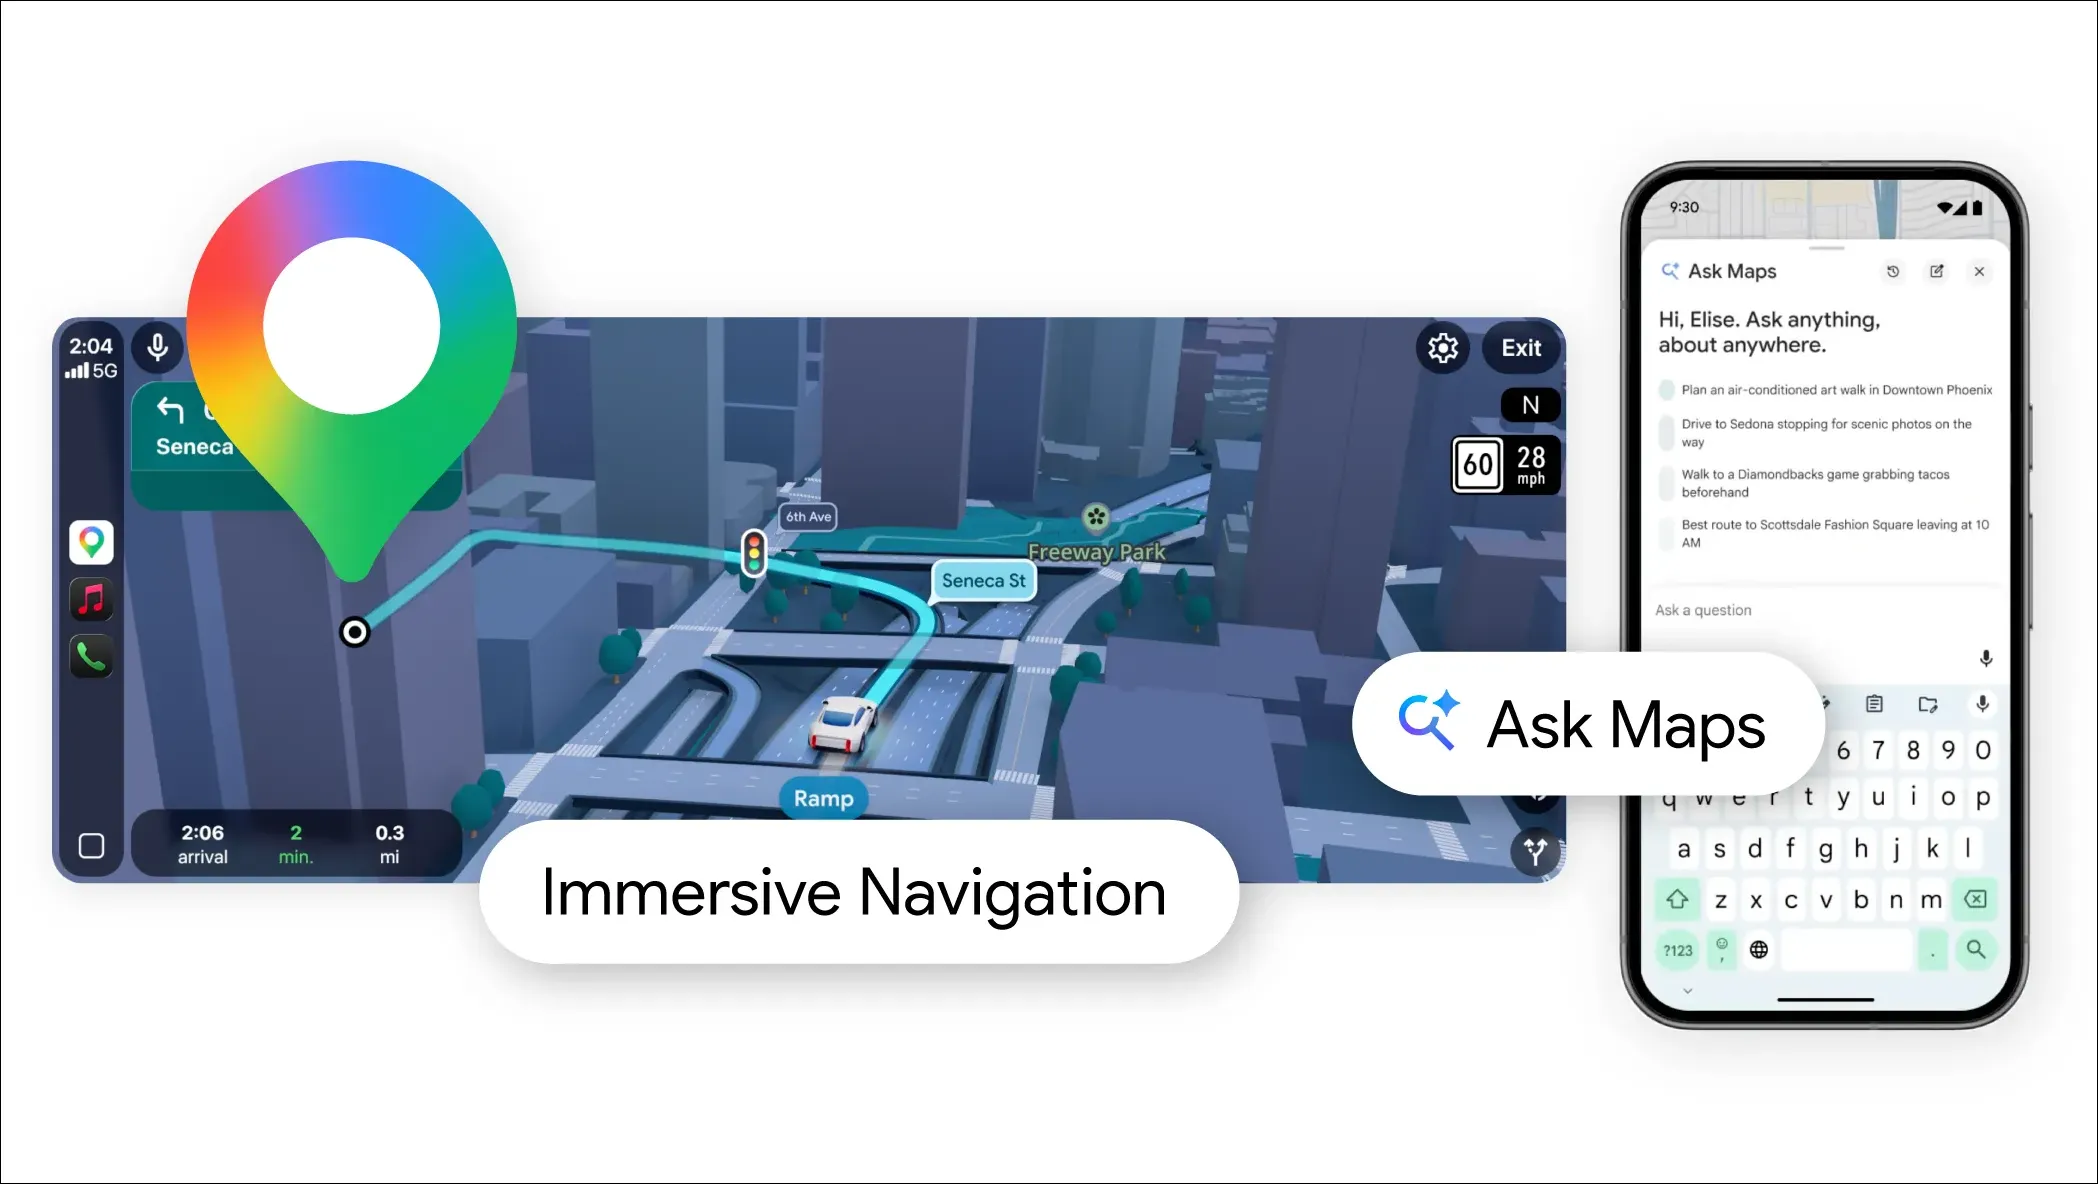
Read Previous Tech News: How Is Gemini AI Transforming Google Maps? The Biggest Maps Update in Over a Decade
1. Turn Words (or Data) Into Live, Interactive Charts in Seconds
Forget switching to Excel, Canva, or Tableau. Just describe what you want in plain English or paste a CSV and Claude instantly creates a fully interactive chart or diagram right inside your conversation.
The charts are actually interactive:
- Hover to see exact numbers and details
- Zoom in/out
- Click elements for more info
- Sometimes even edit them live
What you can build:
- Bar charts, line graphs, pie charts, scatter plots
- Flowcharts, mind maps, org charts, timelines
- Gantt charts, decision trees, process diagrams
- Custom dashboards from uploaded files
Interactive: Copy-Paste These Prompts & Try Them Now
Go to claude.ai (or open the app) and paste any of these, it works instantly:
- “Create an interactive bar chart of the top 10 countries by GDP in 2025 with hover tooltips showing exact values.”
- “Build a colorful pie chart of my monthly budget: Rent $1,200, Food $400, Transport $150, Entertainment $100. Make it hoverable.”
- “Draw an interactive flowchart for launching a startup, with clickable steps that explain each one.”
- “Make a zoomable line graph comparing iPhone vs Android market share over the last 5 years.”
- “Turn this data into an interactive mind map of the solar system planets with key facts on hover.”
- “Create a Gantt chart for a 3-month website redesign project with milestones and deadlines.”
Pro tip: Upload a CSV file or screenshot and say “visualize this data as an interactive dashboard”, Claude handles it perfectly.
2. Why This Update Is Huge
- Students & learners: Turn boring notes into clickable diagrams that actually help you understand.
- Analysts & professionals: Build quick reports, sales dashboards, or project plans without leaving the chat.
- Creators & founders: Visualize ideas, pitch decks, or business models in seconds.
- Everyone: This works on the free plan, so powerful data viz is now available to millions more people.
It builds directly on Claude’s popular “Artifacts” feature (live previews of websites, code, etc.) but now supercharged for visuals. Anthropic is shipping at lightning speed, this comes just days after other big improvements.
How to Start Using It Right Now
- Go to https://claude.ai (or open the Claude app on iOS/Android).
- Start any new chat (or continue an old one).
- Type a prompt like the examples above, the interactive chart appears instantly.
Works on web, mobile, and even in the middle of long conversations.
What This Means
Claude isn’t just answering questions anymore, it’s helping you see your ideas. Whether you’re a student cramming for exams, a manager planning a project, or just someone who loves turning numbers into pictures, this update makes Claude feel like a complete visual co-pilot.
Anthropic keeps raising the bar, and today’s release proves they’re not slowing down.
What’s the first chart or diagram YOU want to build? Drop your craziest or most useful prompt in the comments, the best ones might get turned into real examples!
This is the kind of feature that makes you wonder: what will Claude do next?
Read the previous Tech Contents in this blog: Tech Updates